Analytic tools at PNNL
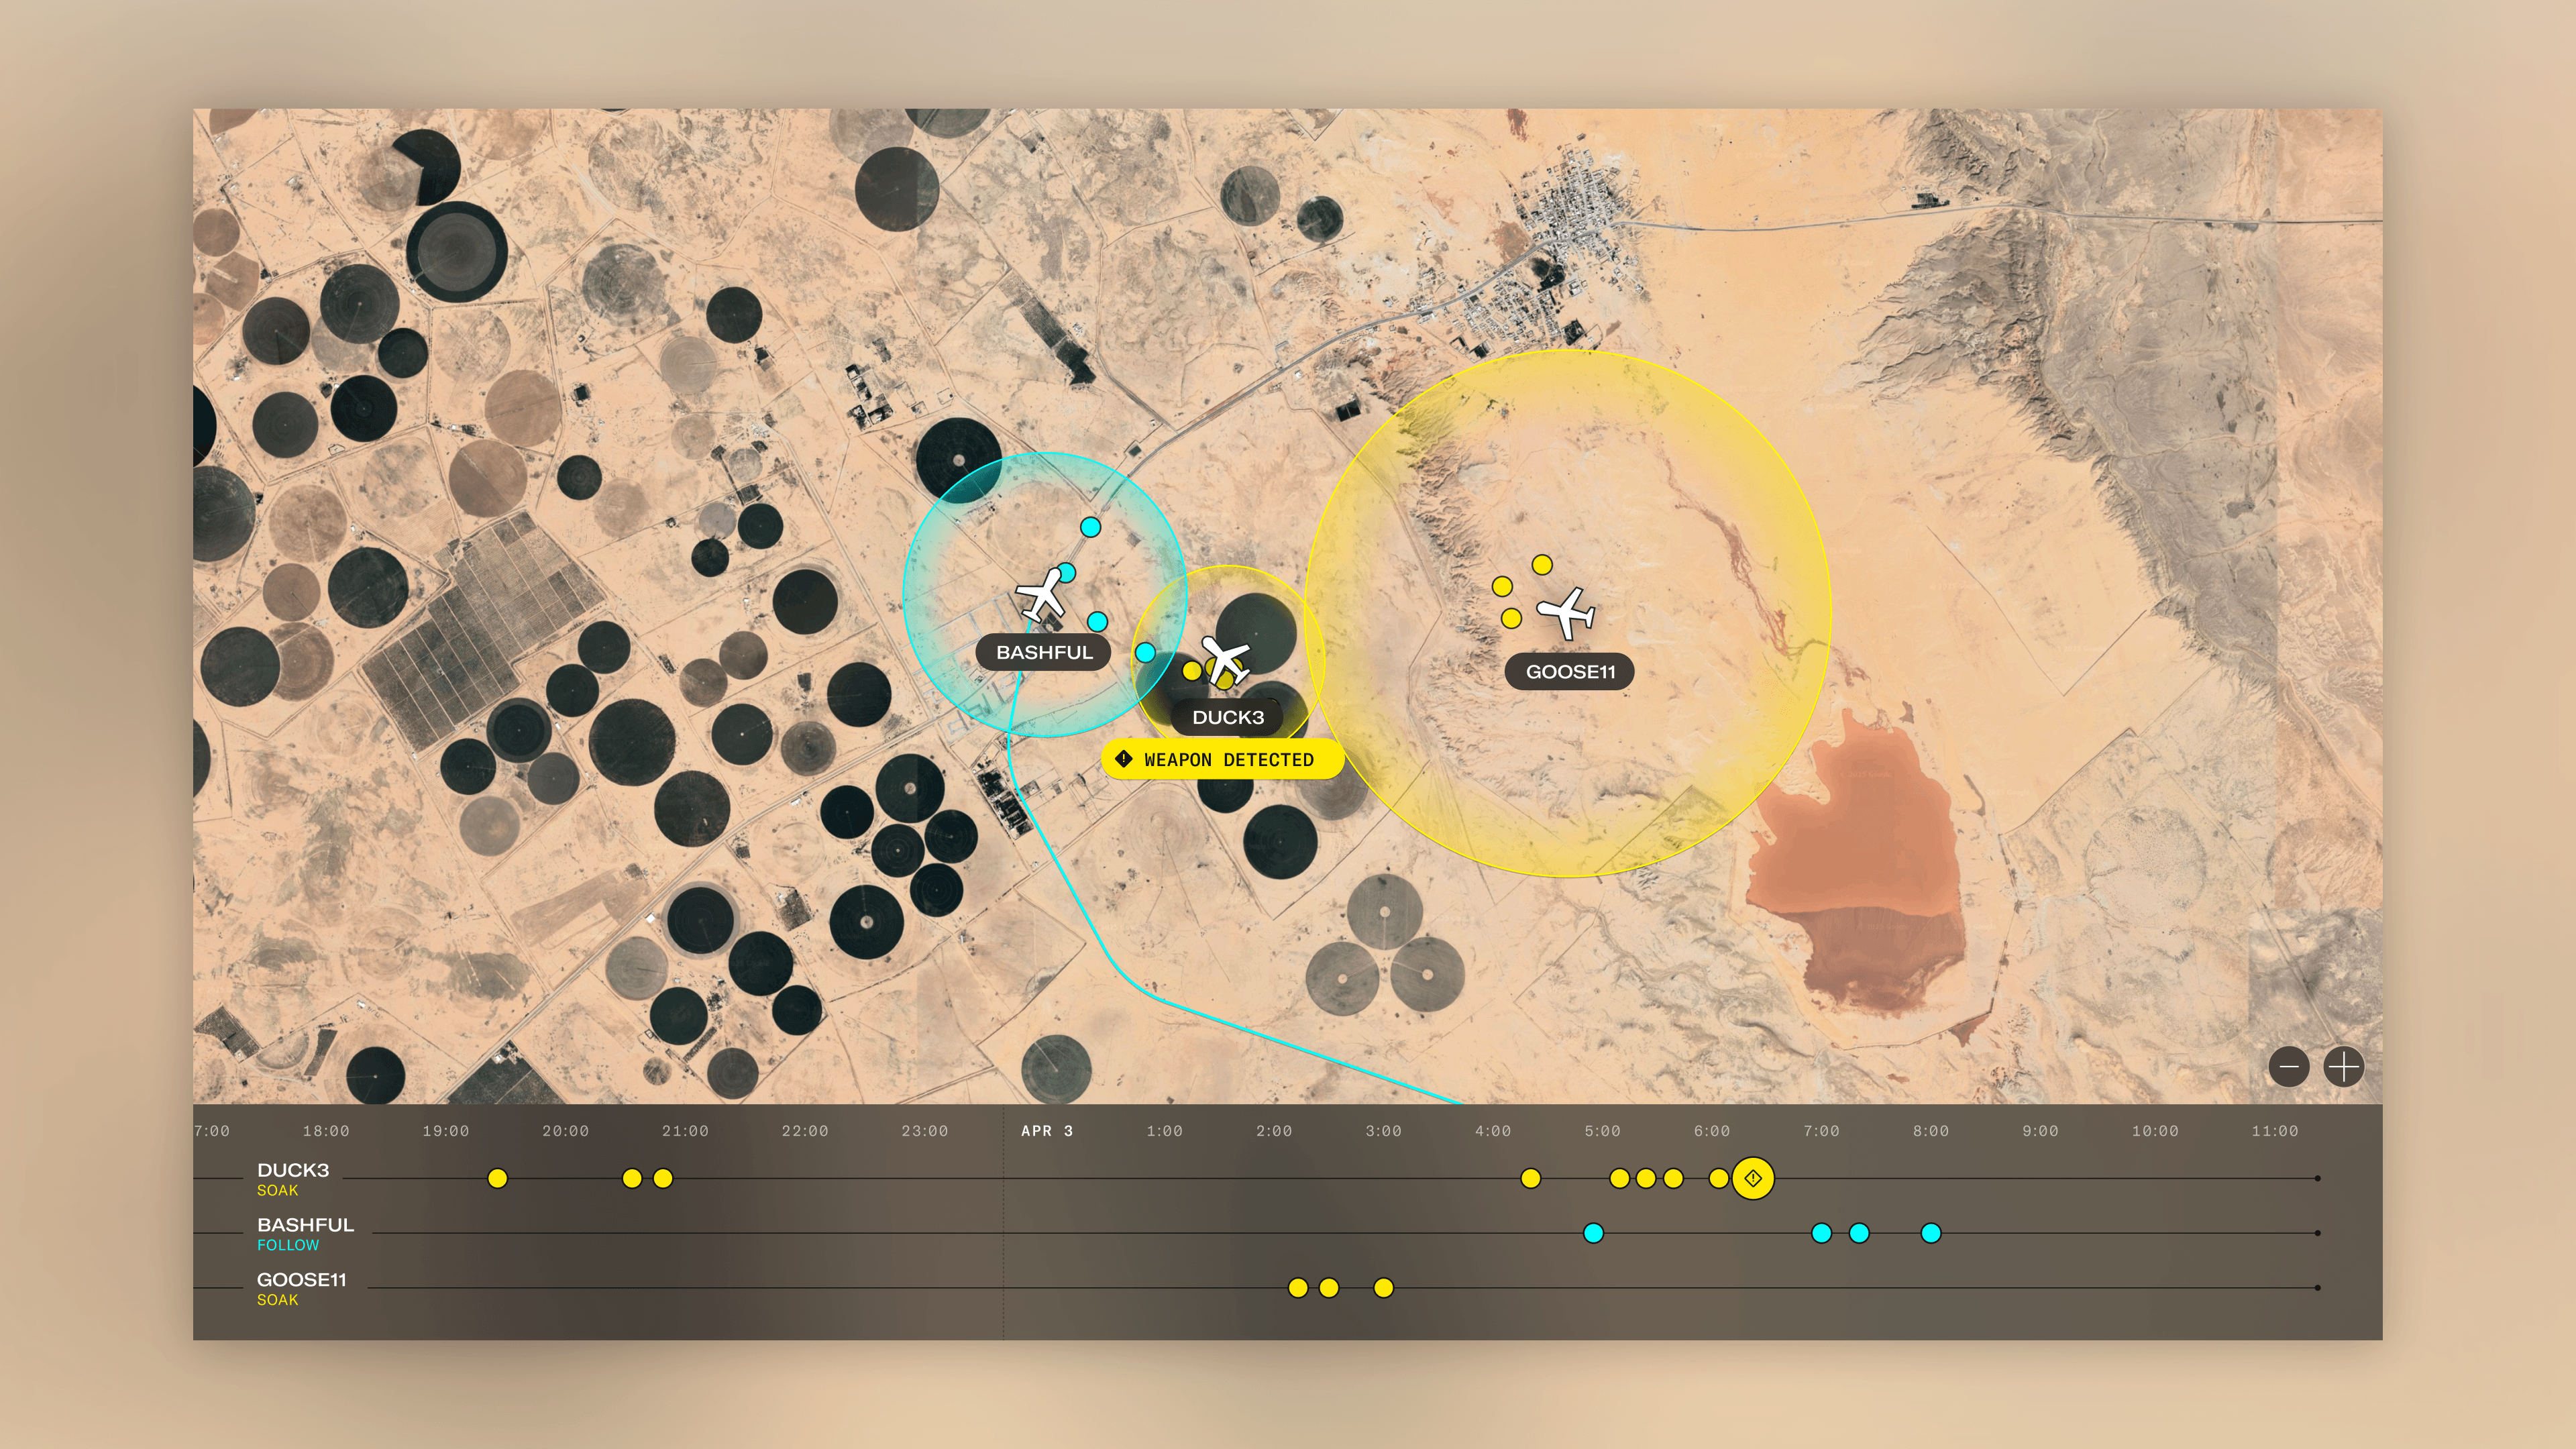
Zoomed-out reconnaissance view showing live assets
This project involved designing visualizations for reconnaissance missions on large mission control screens. This image displays a zoomed-out view of all live assets.

I worked as the sole designer on a lean ~10-person team in the national security domain, where we focused on incubating client ideas to make big and live data understandable and actionable.

Across that work, I designed analytics and visualization tools for reconnaissance, finance, and knowledge-graph data.
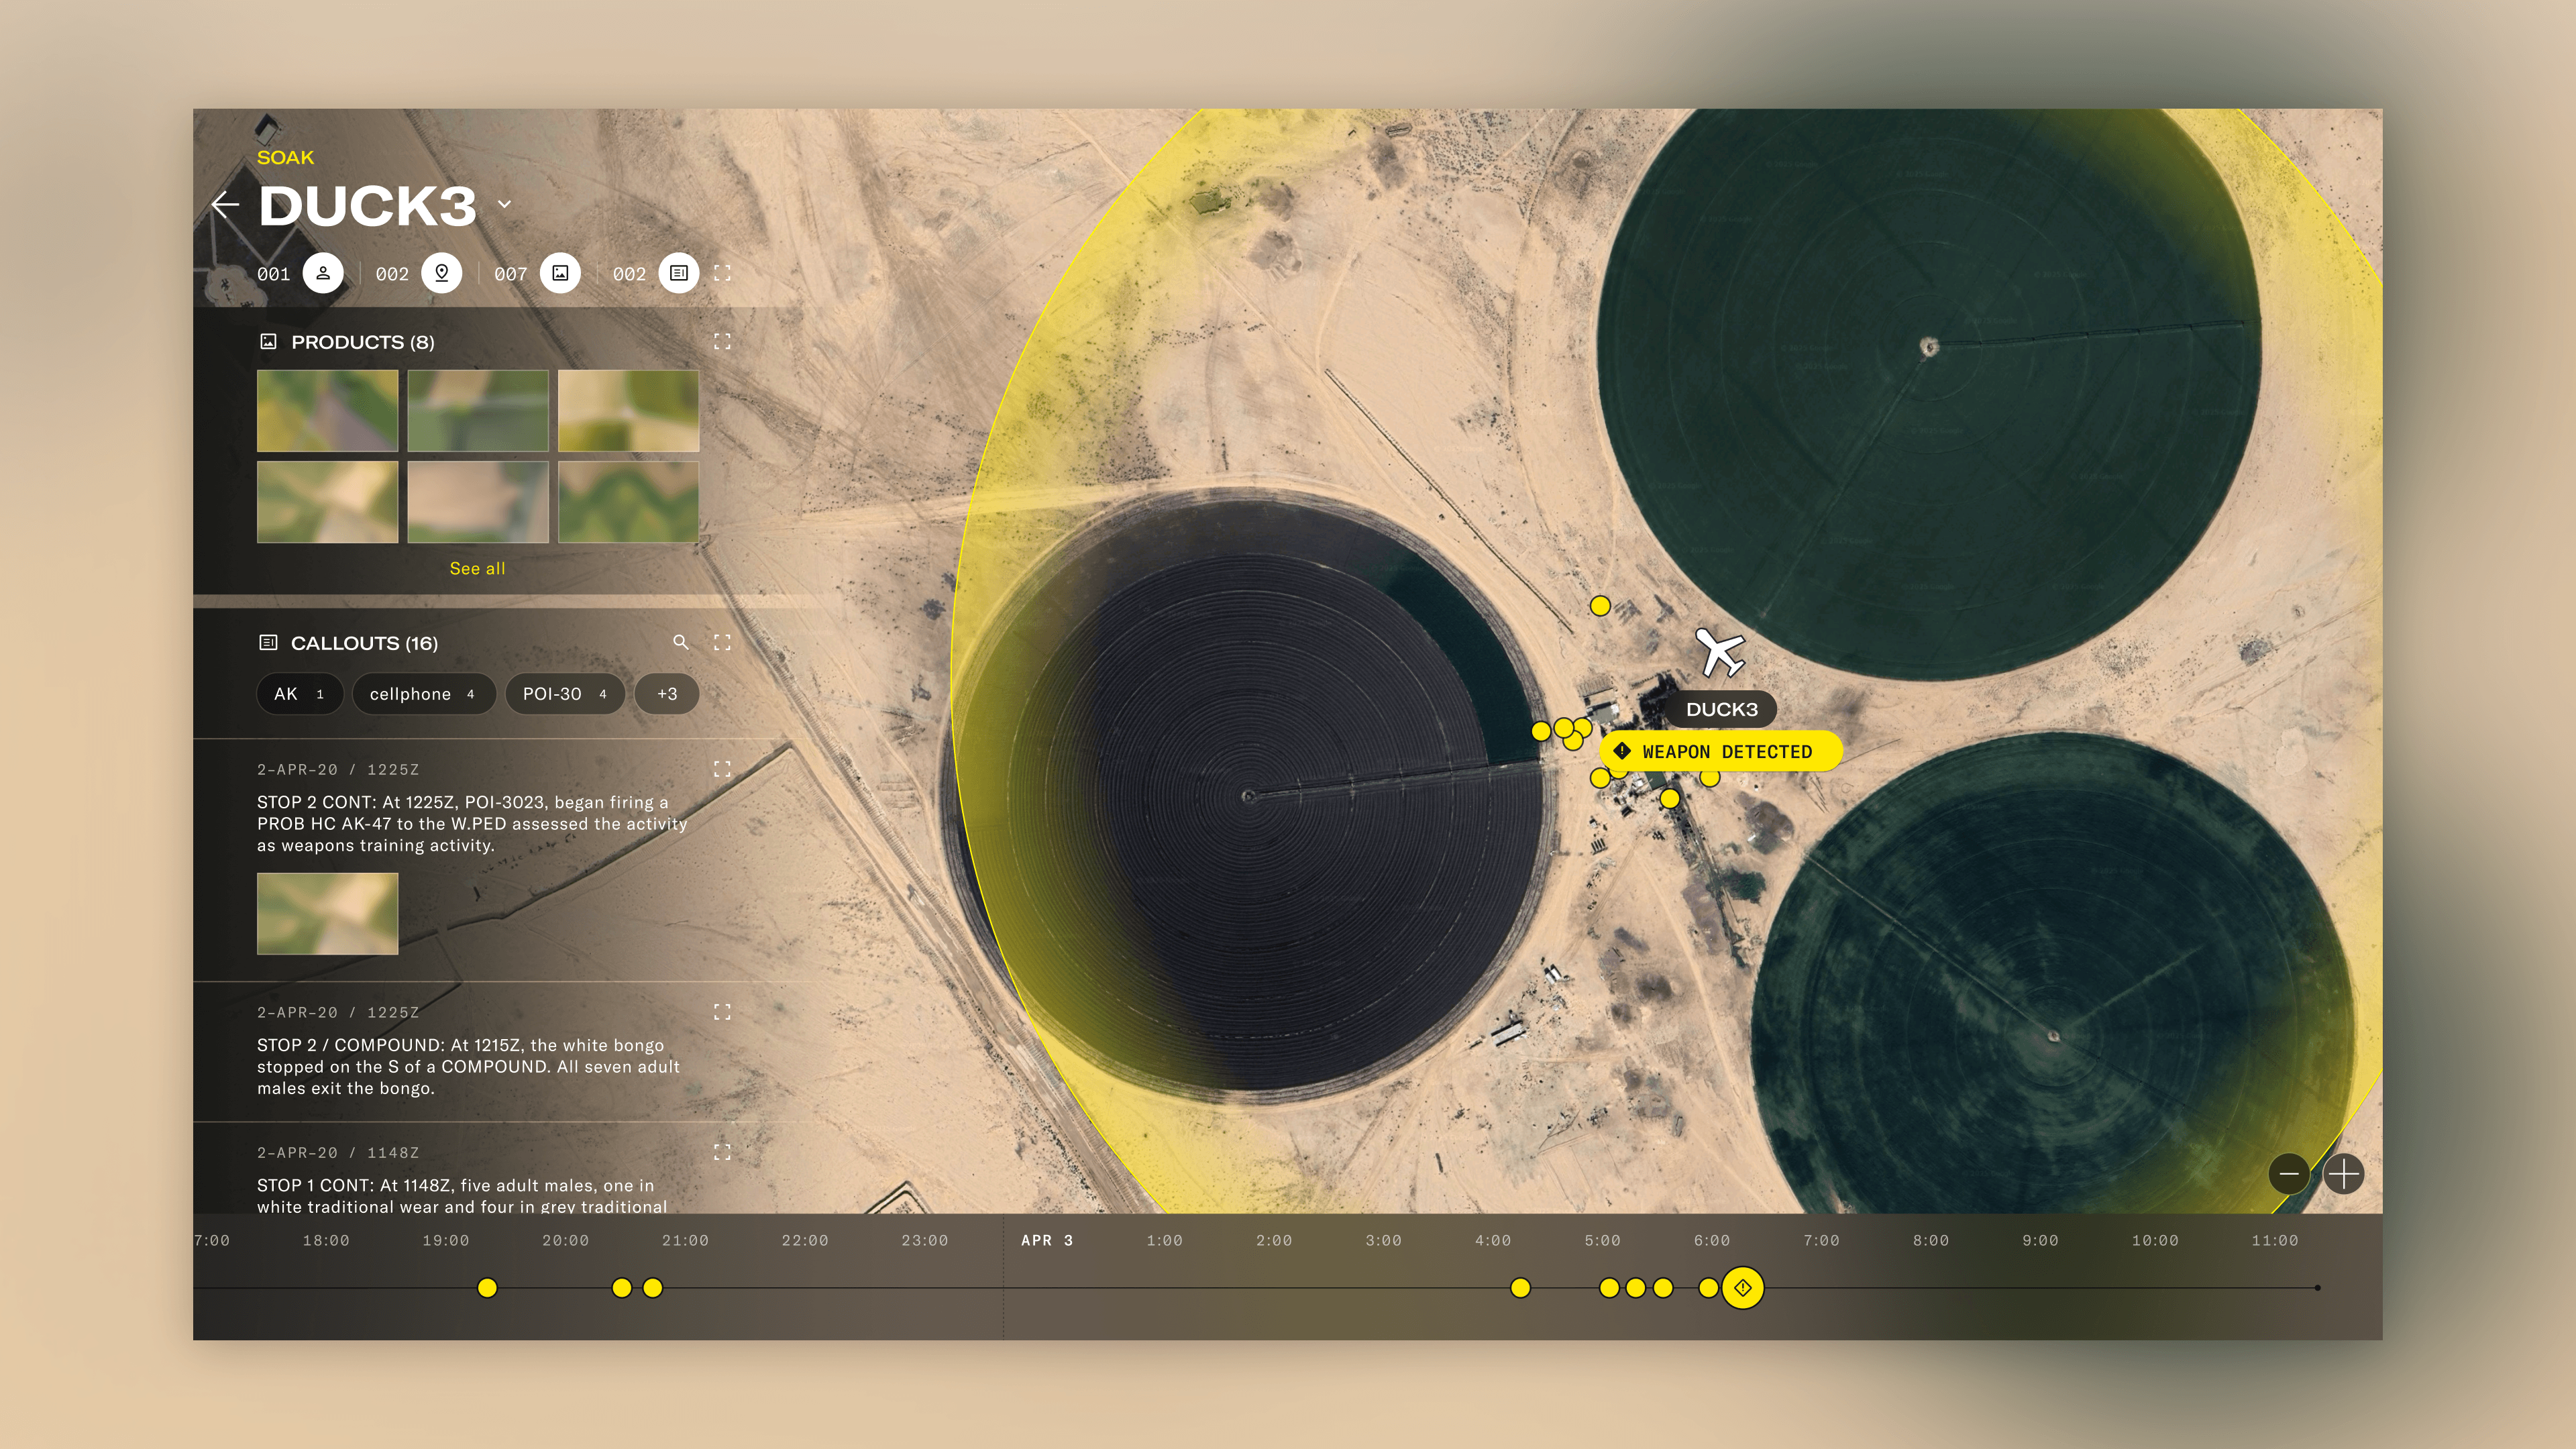
Zoomed-in reconnaissance view of a single asset
This project involved designing visualizations for reconnaissance missions on large mission control screens. This image displays a zoomed-in view of an asset.
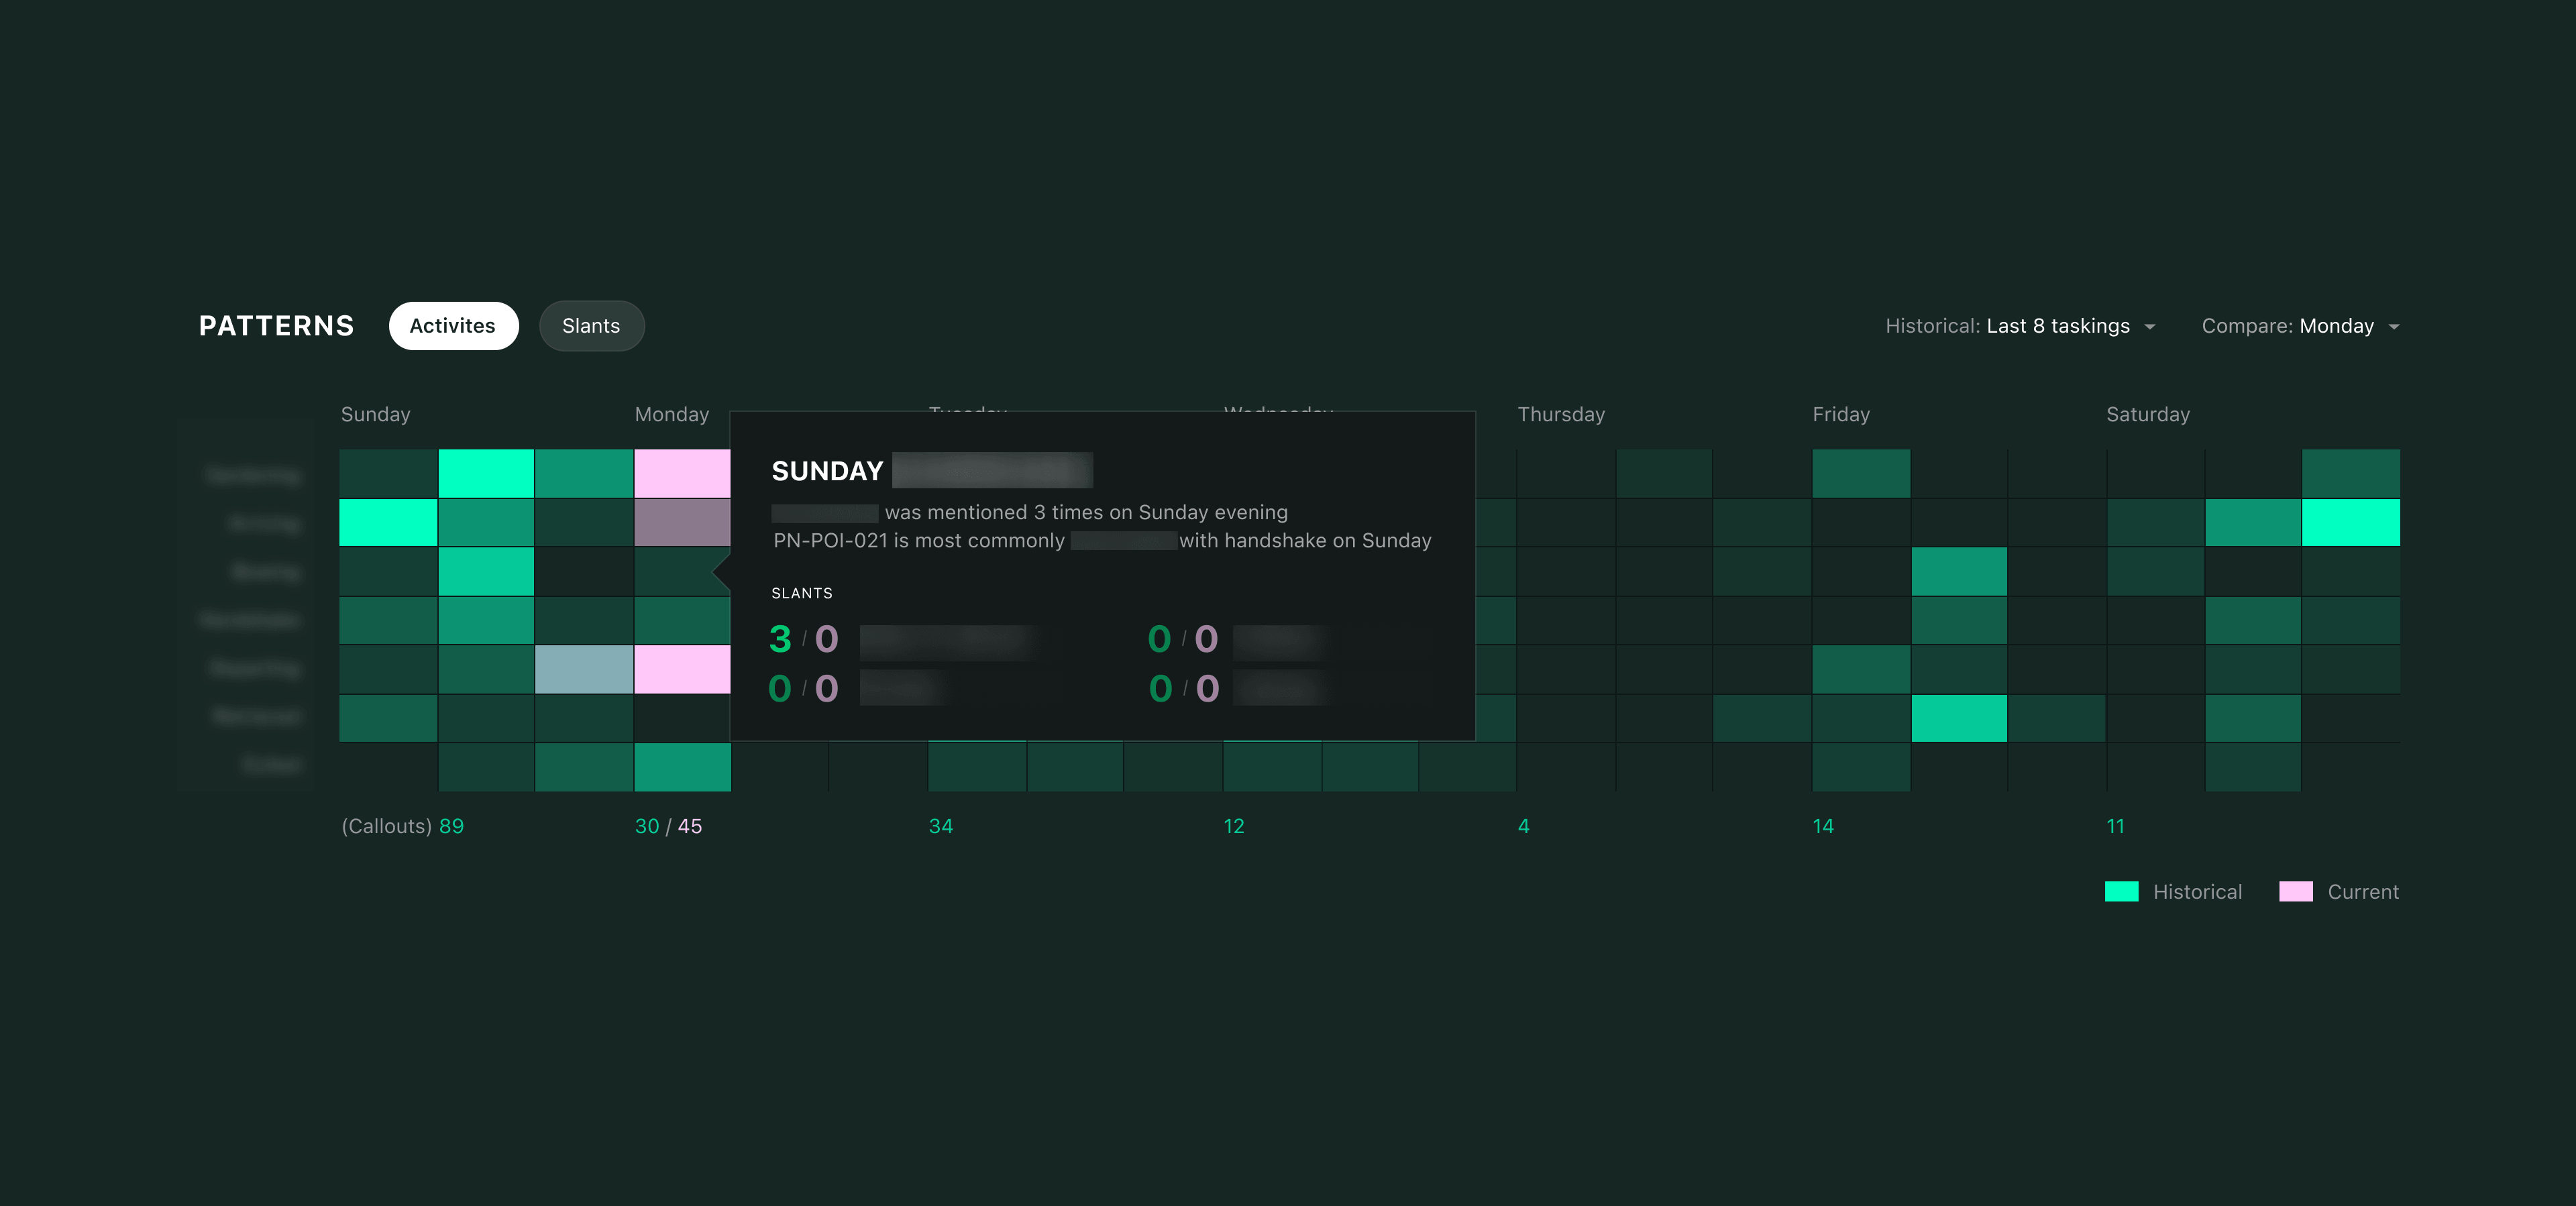
Pattern-of-life visualization for an internal knowledge graph
I designed both the pattern-of-life visualizations and the overarching design system for an internal knowledge graph. This is a pattern-of-life visual that appeared in the top section of various pages.